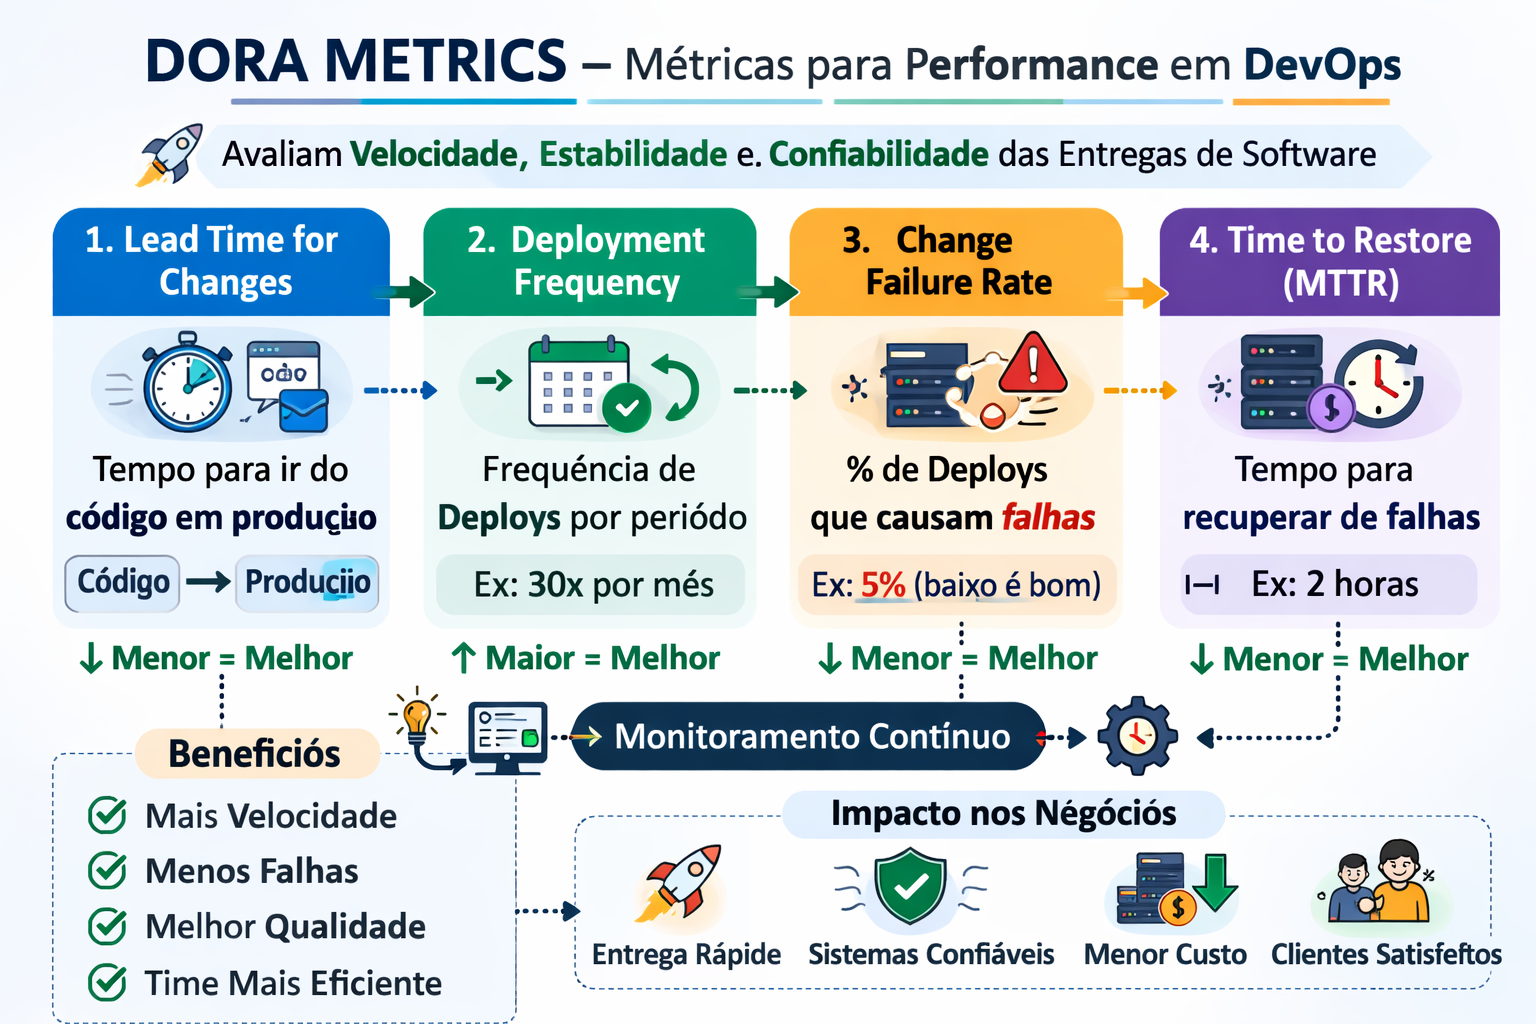
DORA Metrics: Measuring DevOps Performance and Team Excellence
In the world of software development, measuring team performance and delivery efficiency is crucial for continuous improvement. DORA Metrics (DevOps Research and Assessment) provide a scientific, data-driven approach to understanding how well your team delivers software and responds to issues in production.
Developed by the DORA research program (now part of Google Cloud), these metrics are based on six years of research and data from over 32,000 professionals worldwide. They represent the most reliable indicators of software delivery performance and organizational success.
Why DORA Metrics Matter
DORA metrics matter because they directly correlate with:
- Business Performance: Organizations with elite DORA metrics are twice as likely to exceed profitability, market share, and productivity goals
- Employee Satisfaction: High-performing teams report better work-life balance and lower burnout rates
- Customer Satisfaction: Faster delivery and fewer failures lead to happier customers
- Competitive Advantage: Elite performers can respond to market changes 2,604 times faster than low performers
The Four Key DORA Metrics
DORA identified four key metrics that measure both velocity (speed of delivery) and stability (quality and reliability):
1. Deployment Frequency (DF)
Definition: How often your organization successfully releases code to production.
Why it matters: Deployment frequency indicates your team's ability to deliver value to customers quickly. More frequent deployments mean faster feedback loops, reduced risk per deployment, and better ability to respond to market changes.
Performance Levels:
- Elite: On-demand (multiple deploys per day)
- High: Between once per day and once per week
- Medium: Between once per week and once per month
- Low: Between once per month and once every six months
How to Measure:
-- Example: Query deployment frequency from CI/CD logs
SELECT
    DATE(deployment_timestamp) AS deployment_date,
    COUNT(*) AS deployments_per_day,
    AVG(COUNT(*)) OVER (ORDER BY DATE(deployment_timestamp)
        ROWS BETWEEN 29 PRECEDING AND CURRENT ROW) AS rolling_30day_avg
FROM deployments
WHERE environment = 'production'
    AND status = 'success'
    AND deployment_timestamp >= DATE_SUB(CURRENT_DATE(), INTERVAL 90 DAY)
GROUP BY DATE(deployment_timestamp)
ORDER BY deployment_date DESC;
Practical Example:
// C# example: Tracking deployments with Application Insights
public class DeploymentTracker
{
    private readonly TelemetryClient _telemetry;

    public async Task TrackDeploymentAsync(string version, string environment)
    {
        var properties = new Dictionary
        {
            { "Version", version },
            { "Environment", environment },
            { "DeployedBy", Environment.UserName },
            { "Timestamp", DateTime.UtcNow.ToString("o") }
        };

        var metrics = new Dictionary
        {
            { "DeploymentCount", 1 }
        };

        _telemetry.TrackEvent("Deployment", properties, metrics);
        await _telemetry.FlushAsync();
    }
}

// Usage in deployment pipeline
var tracker = new DeploymentTracker(telemetryClient);
await tracker.TrackDeploymentAsync("v2.5.1", "production");
How to Improve:
- Implement CI/CD pipelines with automated testing
- Adopt trunk-based development or short-lived feature branches
- Automate deployment processes
- Reduce batch sizes (deploy smaller changes more frequently)
- Use feature flags to decouple deployment from release
2. Lead Time for Changes (LT)
Definition: The time it takes for a commit to get into production.
Why it matters: Lead time measures your team's efficiency in delivering value. Shorter lead times mean faster feedback, quicker time-to-market, and better ability to experiment and iterate.
Performance Levels:
- Elite: Less than one hour
- High: Between one day and one week
- Medium: Between one week and one month
- Low: Between one month and six months
How to Measure:
# Python example: Calculate lead time from Git and deployment data
from datetime import datetime
import pandas as pd

def calculate_lead_time(commits_df, deployments_df):
    """
    Calculate lead time for each deployment

    commits_df: DataFrame with columns [commit_hash, commit_timestamp]
    deployments_df: DataFrame with columns [deployment_id, commit_hash, deployment_timestamp]
    """
    # Merge commits with deployments
    merged = deployments_df.merge(commits_df, on='commit_hash')

    # Calculate lead time in hours
    merged['lead_time_hours'] = (
        merged['deployment_timestamp'] - merged['commit_timestamp']
    ).dt.total_seconds() / 3600

    # Calculate statistics
    stats = {
        'mean_lead_time': merged['lead_time_hours'].mean(),
        'median_lead_time': merged['lead_time_hours'].median(),
        'p95_lead_time': merged['lead_time_hours'].quantile(0.95),
        'min_lead_time': merged['lead_time_hours'].min(),
        'max_lead_time': merged['lead_time_hours'].max()
    }

    return stats

# Example usage
commits = pd.DataFrame({
    'commit_hash': ['abc123', 'def456', 'ghi789'],
    'commit_timestamp': pd.to_datetime([
        '2024-02-01 10:00:00',
        '2024-02-01 14:30:00',
        '2024-02-02 09:15:00'
    ])
})

deployments = pd.DataFrame({
    'deployment_id': [1, 2, 3],
    'commit_hash': ['abc123', 'def456', 'ghi789'],
    'deployment_timestamp': pd.to_datetime([
        '2024-02-01 15:00:00',
        '2024-02-02 10:00:00',
        '2024-02-02 16:30:00'
    ])
})

lead_time_stats = calculate_lead_time(commits, deployments)
print(f"Average Lead Time: {lead_time_stats['mean_lead_time']:.2f} hours")
Real-World Example:
A typical journey for a code change:
- Commit: Developer commits code at 9:00 AM
- CI Build: Automated tests run (15 minutes)
- Code Review: PR reviewed and approved (2 hours)
- Merge: Code merged to main branch (immediate)
- CD Pipeline: Automated deployment to staging (10 minutes)
- Testing: Automated integration tests (20 minutes)
- Production Deploy: Automated deployment to production (10 minutes)
- Total Lead Time: ~3 hours
How to Improve:
- Automate testing and deployment processes
- Reduce code review time with smaller PRs
- Implement continuous deployment (not just continuous integration)
- Remove manual approval gates where possible
- Optimize build and test execution times
- Use parallel testing strategies
3. Change Failure Rate (CFR)
Definition: The percentage of deployments that cause a failure in production requiring immediate remedy (hotfix, rollback, fix forward, patch).
Why it matters: CFR measures the quality and stability of your releases. A lower failure rate indicates better testing practices, more reliable processes, and higher confidence in deployments.
Performance Levels:
- Elite: 0-15%
- High: 16-30%
- Medium: 31-45%
- Low: 46-60%
How to Measure:
// JavaScript/Node.js example: Calculate change failure rate
class ChangeFailureRateCalculator {
    constructor(deployments, incidents) {
        this.deployments = deployments;
        this.incidents = incidents;
    }

    calculateCFR(startDate, endDate) {
        // Filter deployments in date range
        const deploymentsInRange = this.deployments.filter(d =>
            d.timestamp >= startDate && d.timestamp <= endDate
        );

        // Find incidents caused by deployments
        const failedDeployments = new Set();

        this.incidents.forEach(incident => {
            // Find deployment that caused this incident
            const causingDeployment = deploymentsInRange.find(d =>
                d.timestamp <= incident.timestamp &&
                incident.timestamp - d.timestamp <= 24 * 60 * 60 * 1000 && // Within 24h
                incident.rootCause === 'deployment'
            );

            if (causingDeployment) {
                failedDeployments.add(causingDeployment.id);
            }
        });

        const totalDeployments = deploymentsInRange.length;
        const failedCount = failedDeployments.size;
        const cfr = (failedCount / totalDeployments) * 100;

        return {
            totalDeployments,
            failedDeployments: failedCount,
            changeFailureRate: cfr.toFixed(2),
            performanceLevel: this.getPerformanceLevel(cfr)
        };
    }

    getPerformanceLevel(cfr) {
        if (cfr <= 15) return 'Elite';
        if (cfr <= 30) return 'High';
        if (cfr <= 45) return 'Medium';
        return 'Low';
    }
}

// Example usage
const deployments = [
    { id: 1, timestamp: new Date('2024-02-01T10:00:00Z') },
    { id: 2, timestamp: new Date('2024-02-02T14:00:00Z') },
    { id: 3, timestamp: new Date('2024-02-03T09:00:00Z') },
    { id: 4, timestamp: new Date('2024-02-04T11:00:00Z') },
    { id: 5, timestamp: new Date('2024-02-05T15:00:00Z') }
];

const incidents = [
    {
        id: 1,
        timestamp: new Date('2024-02-02T15:30:00Z'),
        rootCause: 'deployment'
    }
];

const calculator = new ChangeFailureRateCalculator(deployments, incidents);
const result = calculator.calculateCFR(
    new Date('2024-02-01'),
    new Date('2024-02-28')
);

console.log(`Change Failure Rate: ${result.changeFailureRate}%`);
console.log(`Performance Level: ${result.performanceLevel}`);
What Counts as a Failure?
- Production incidents requiring immediate action
- Rollbacks to previous versions
- Hotfixes deployed outside normal process
- Service degradation or outages
- Critical bugs affecting users
What Doesn't Count:
- Minor bugs fixed in next regular deployment
- Issues caught in staging/testing
- Planned maintenance
- Configuration changes
How to Improve:
- Implement comprehensive automated testing (unit, integration, E2E)
- Use feature flags for gradual rollouts
- Implement canary deployments or blue-green deployments
- Conduct thorough code reviews
- Use static code analysis and linting
- Implement chaos engineering practices
- Conduct post-incident reviews and learn from failures
4. Time to Restore Service (MTTR)
Definition: How long it takes to restore service when a service incident or defect that impacts users occurs.
Why it matters: MTTR measures your team's ability to respond to and recover from failures. Faster recovery times mean less downtime, reduced customer impact, and better overall reliability.
Performance Levels:
- Elite: Less than one hour
- High: Less than one day
- Medium: Between one day and one week
- Low: More than one week
How to Measure:
// Go example: Calculate MTTR from incident data
package main

import (
    "fmt"
    "time"
)

type Incident struct {
    ID          string
    DetectedAt  time.Time
    ResolvedAt  time.Time
    Severity    string
}

type MTTRCalculator struct {
    incidents []Incident
}

func (m *MTTRCalculator) CalculateMTTR(startDate, endDate time.Time) map[string]interface{} {
    var totalDuration time.Duration
    var count int
    var durations []time.Duration

    for _, incident := range m.incidents {
        if incident.DetectedAt.After(startDate) && incident.DetectedAt.Before(endDate) {
            duration := incident.ResolvedAt.Sub(incident.DetectedAt)
            durations = append(durations, duration)
            totalDuration += duration
            count++
        }
    }

    if count == 0 {
        return map[string]interface{}{
            "mttr_hours": 0,
            "incident_count": 0,
        }
    }

    meanMTTR := totalDuration / time.Duration(count)

    // Calculate median
    sort.Slice(durations, func(i, j int) bool {
        return durations[i] < durations[j]
    })

    var medianMTTR time.Duration
    if count%2 == 0 {
        medianMTTR = (durations[count/2-1] + durations[count/2]) / 2
    } else {
        medianMTTR = durations[count/2]
    }

    return map[string]interface{}{
        "mttr_hours":        meanMTTR.Hours(),
        "median_mttr_hours": medianMTTR.Hours(),
        "incident_count":    count,
        "performance_level": getPerformanceLevel(meanMTTR.Hours()),
    }
}

func getPerformanceLevel(hours float64) string {
    if hours < 1 {
        return "Elite"
    } else if hours < 24 {
        return "High"
    } else if hours < 168 { // 1 week
        return "Medium"
    }
    return "Low"
}

// Example usage
func main() {
    incidents := []Incident{
        {
            ID:         "INC-001",
            DetectedAt: time.Date(2024, 2, 1, 10, 0, 0, 0, time.UTC),
            ResolvedAt: time.Date(2024, 2, 1, 10, 45, 0, 0, time.UTC),
            Severity:   "High",
        },
        {
            ID:         "INC-002",
            DetectedAt: time.Date(2024, 2, 5, 14, 0, 0, 0, time.UTC),
            ResolvedAt: time.Date(2024, 2, 5, 16, 30, 0, 0, time.UTC),
            Severity:   "Critical",
        },
    }

    calculator := &MTTRCalculator{incidents: incidents}
    result := calculator.CalculateMTTR(
        time.Date(2024, 2, 1, 0, 0, 0, 0, time.UTC),
        time.Date(2024, 2, 28, 23, 59, 59, 0, time.UTC),
    )

    fmt.Printf("MTTR: %.2f hours\n", result["mttr_hours"])
    fmt.Printf("Performance Level: %s\n", result["performance_level"])
}
Real-World Recovery Scenario:
- Detection (T+0): Monitoring alerts fire, incident detected
- Response (T+5min): On-call engineer acknowledges alert
- Diagnosis (T+15min): Root cause identified (bad deployment)
- Decision (T+20min): Team decides to rollback
- Rollback (T+25min): Automated rollback executed
- Verification (T+30min): Service health confirmed
- Resolution (T+35min): Incident closed
- Total MTTR: 35 minutes (Elite performance)
How to Improve:
- Implement comprehensive monitoring and alerting
- Create runbooks and incident response procedures
- Practice incident response with game days
- Implement automated rollback capabilities
- Use feature flags to quickly disable problematic features
- Maintain good observability (logs, metrics, traces)
- Establish clear on-call rotations and escalation paths
- Conduct blameless post-mortems
Implementing DORA Metrics in Your Organization
Step 1: Establish Baseline Measurements
# Example: GitHub Actions workflow to track DORA metrics
name: Track DORA Metrics

on:
  deployment_status:
  push:
    branches: [main]

jobs:
  track-metrics:
    runs-on: ubuntu-latest
    steps:
      - name: Track Deployment
        if: github.event.deployment_status.state == success
        run: |
          curl -X POST https://your-metrics-api.com/deployments
            -H Content-Type: application/json
            -d deployment_id: DEPLOYMENT_ID

      - name: Calculate Lead Time
        run: |
          COMMIT_TIME=COMMIT_TIMESTAMP
          DEPLOY_TIME=DEPLOY_TIMESTAMP
          curl -X POST https://your-metrics-api.com/lead-time
            -H Content-Type: application/json
            -d commit_sha: COMMIT_SHA
Step 2: Create Dashboards
Build dashboards to visualize your metrics over time. Key visualizations include:
- Deployment frequency trend (deployments per day/week)
- Lead time distribution (histogram)
- Change failure rate over time (percentage)
- MTTR trend (hours/minutes)
- Comparison against industry benchmarks
Step 3: Set Goals and Track Progress
## Q1 2024 DORA Metrics Goals

### Current State (Baseline)
- Deployment Frequency: 2x per week (Medium)
- Lead Time: 3 days (Medium)
- Change Failure Rate: 25% (High)
- MTTR: 4 hours (High)

### Q1 Goals
- Deployment Frequency: 1x per day (High)
- Lead Time: 1 day (High)
- Change Failure Rate: 20% (High)
- MTTR: 2 hours (High)

### Actions
1. Implement automated deployment pipeline
2. Add comprehensive test coverage
3. Create incident response runbooks
4. Establish monitoring and alerting
Common Pitfalls and How to Avoid Them
1. Gaming the Metrics
Problem: Teams deploy trivial changes to inflate deployment frequency.
Solution: Focus on delivering value, not just hitting numbers. Track meaningful changes that impact users.
2. Ignoring Context
Problem: Comparing metrics across different types of systems (e.g., mobile apps vs. web services).
Solution: Benchmark against similar systems and focus on your own improvement trends.
3. Sacrificing Quality for Speed
Problem: Increasing deployment frequency at the cost of higher change failure rate.
Solution: Balance velocity and stability metrics. Elite performers excel at both.
4. Not Acting on Data
Problem: Collecting metrics but not using them to drive improvements.
Solution: Regularly review metrics in team retrospectives and create action plans.
Tools for Measuring DORA Metrics
Commercial Solutions
- Sleuth: Automated DORA metrics tracking
- LinearB: Engineering metrics platform
- Jellyfish: Engineering management platform
- Haystack: Engineering analytics
Open Source / DIY
- Four Keys: Google's open-source DORA metrics implementation
- Grafana + Prometheus: Custom dashboards
- ELK Stack: Log-based metrics
- Custom scripts: Extract from Git, CI/CD, and incident management tools
Integration Points
- Version Control: GitHub, GitLab, Bitbucket
- CI/CD: Jenkins, GitHub Actions, GitLab CI, CircleCI
- Incident Management: PagerDuty, Opsgenie, VictorOps
- Monitoring: Datadog, New Relic, Application Insights
Real-World Success Stories
Case Study 1: E-Commerce Platform
Before:
- Deployment Frequency: Once per month
- Lead Time: 2 weeks
- Change Failure Rate: 40%
- MTTR: 8 hours
Actions Taken:
- Implemented CI/CD pipeline with automated testing
- Adopted trunk-based development
- Introduced feature flags
- Created automated rollback procedures
After (6 months):
- Deployment Frequency: Multiple times per day
- Lead Time: 4 hours
- Change Failure Rate: 12%
- MTTR: 45 minutes
Business Impact: 30% faster time-to-market, 50% reduction in production incidents, improved team morale.
Best Practices for DORA Metrics
- Start Simple: Begin with manual tracking if needed, automate later
- Be Consistent: Use the same definitions and measurement methods over time
- Focus on Trends: Look at improvement over time, not absolute numbers
- Balance All Four: Don't optimize one metric at the expense of others
- Make it Visible: Display metrics prominently for the team
- Review Regularly: Discuss metrics in retrospectives and planning
- Celebrate Improvements: Recognize progress and wins
- Learn from Setbacks: Use regressions as learning opportunities
Conclusion
DORA Metrics provide a powerful framework for measuring and improving software delivery performance. By tracking these four key metrics—Deployment Frequency, Lead Time for Changes, Change Failure Rate, and Time to Restore Service—teams can identify bottlenecks, drive improvements, and ultimately deliver better software faster.
Remember that the goal isn't to achieve "Elite" status overnight, but to continuously improve. Start measuring where you are today, set realistic goals, and work systematically to enhance your processes. The journey to high performance is iterative, and every improvement counts.
Elite performers aren't born—they're built through consistent measurement, learning, and improvement. Start your DORA metrics journey today and join the ranks of high-performing software delivery teams.