Distributed Monitoring System
Real-time distributed system monitoring with alerts and metrics visualization.
About the Project
Distributed Monitoring System is a comprehensive solution for real-time monitoring of distributed systems and applications. Built with modern technologies and microservices architecture, it provides powerful monitoring capabilities, alerting, and metrics visualization.
Key Features
- Real-time Monitoring: Track system metrics, application performance, and infrastructure health in real-time;
- Alert Management: Configure custom alert rules with multiple notification channels (email, Slack, webhooks);
- Metrics Collection: Collect and store metrics from multiple sources with high throughput;
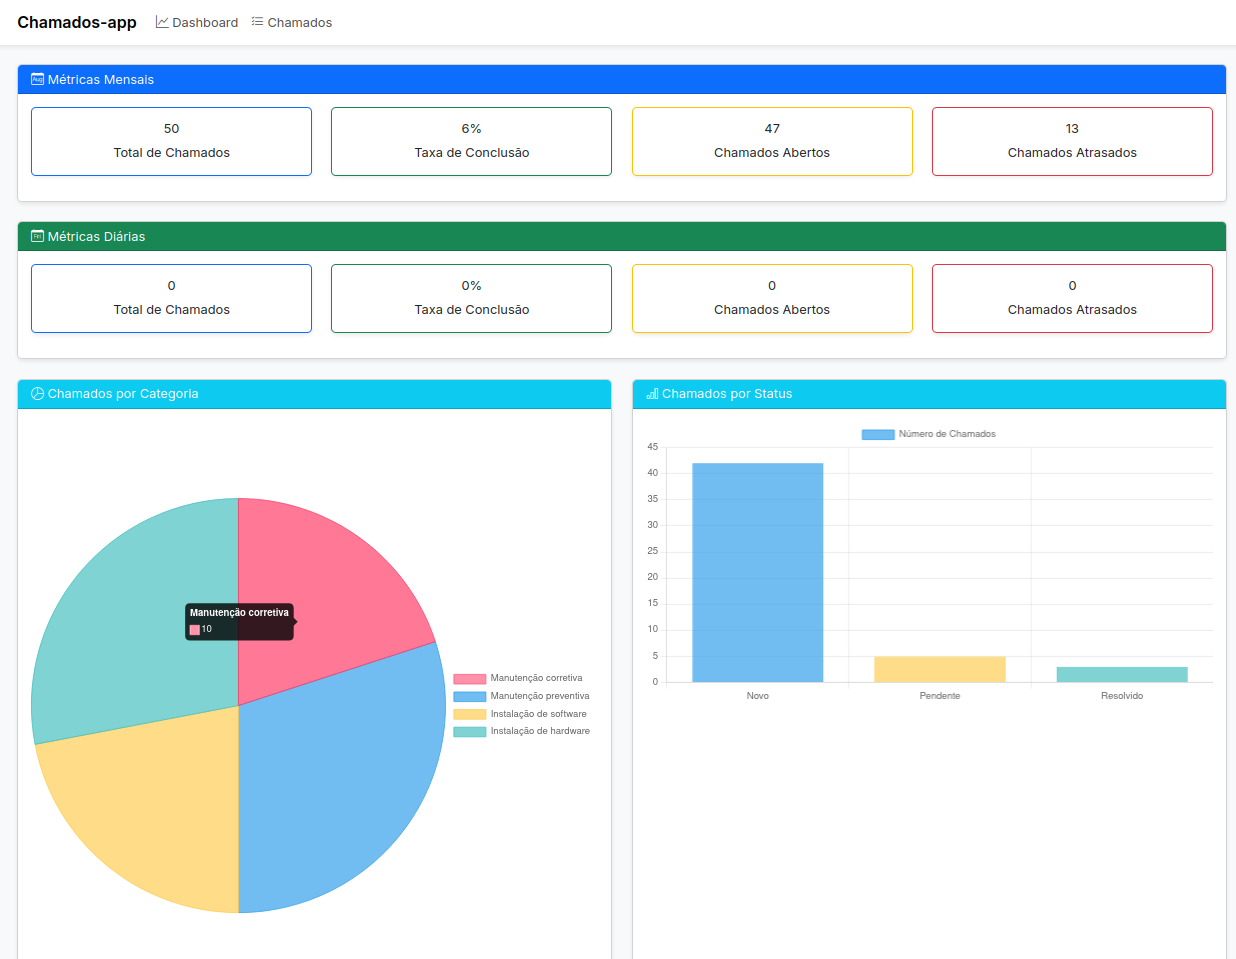
- Dashboard Visualization: Interactive dashboards with charts and graphs for metrics analysis;
- Distributed Architecture: Scalable microservices architecture with message queuing;
- API Integration: RESTful APIs for easy integration with existing systems;
- Data Persistence: Efficient storage with PostgreSQL and Redis caching;
- Docker Support: Fully containerized with Docker Compose for easy deployment.
Technical Architecture
The system is built using a microservices architecture with the following components:
- API Gateway (Ocelot): Routing, rate limiting, and load balancing;
- Identity Provider (Keycloak 23): OAuth 2.0 / OIDC authentication and authorization;
- Metrics Collector: Background service collecting metrics from monitored targets;
- Alert Engine: Evaluates alert rules and triggers notifications;
- Message Broker (RabbitMQ 3.12): Asynchronous communication between services;
- Database (PostgreSQL 16): Persistent storage with Entity Framework Core 10.0;
- Cache Layer (Redis 7): High-performance distributed caching;
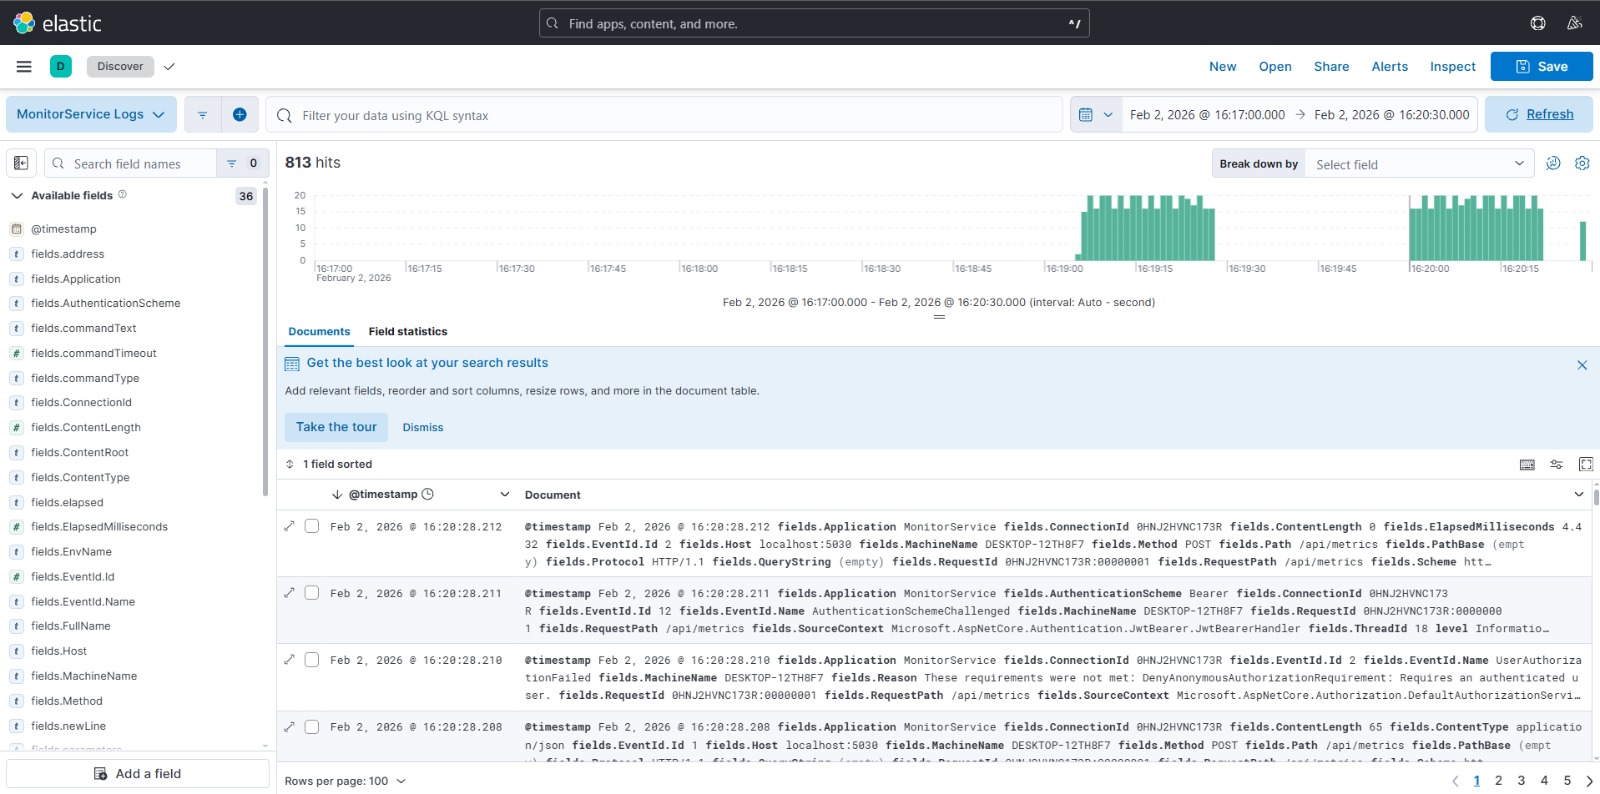
- ELK Stack: Elasticsearch 8.11, Logstash 8.11, and Kibana 8.11 for log management and visualization;
Technologies Used
Core Technologies
- .NET 10.0: Runtime framework
- C# 12: Programming language
- ASP.NET Core 10.0: Web API framework
- Entity Framework Core 10.0: ORM for database access
Infrastructure Components
- PostgreSQL 16: Primary data store (Port 5432)
- RabbitMQ 3.12: Message broker for async communication (Ports 5672, 15672)
- Redis 7: Distributed caching (Port 6379)
- Ocelot: API Gateway for routing and rate limiting (Port 5000)
- Keycloak 23: Identity provider with OAuth 2.0 / OIDC (Port 8080)
- Elasticsearch 8.11: Log storage and search (Port 9200)
- Kibana 8.11: Visualization dashboards (Port 5601)
- Logstash 8.11: Log processing pipeline (Port 5000)
Development Tools
- Docker & Docker Compose: Containerization and orchestration
- Serilog: Structured logging
- FluentValidation: Input validation
- Swagger/OpenAPI: API documentation
- xUnit: Unit testing framework
Design Patterns and Best Practices
- Clean Architecture: Separation of concerns with clear layer boundaries;
- CQRS Pattern: Command Query Responsibility Segregation using MediatR;
- Repository Pattern: Abstraction layer for data access;
- Dependency Injection: Built-in .NET DI container for loose coupling;
- SOLID Principles: Following object-oriented design principles;
- Unit Testing: Comprehensive test coverage with xUnit;
- API Versioning: Support for multiple API versions;
- Error Handling: Global exception handling with custom middleware.
Monitoring Capabilities
The system can monitor various types of metrics:
- System Metrics: CPU usage, memory consumption, disk I/O;
- Application Metrics: Request rates, response times, error rates;
- Infrastructure Metrics: Network traffic, database connections, queue depth;
- Custom Metrics: User-defined metrics via API;
- Health Checks: Endpoint availability and response validation.
Alert System
Flexible alerting system with multiple features:
- Threshold-based alerts (greater than, less than, equals)
- Time-window aggregations (average, sum, count)
- Multiple notification channels (email, Slack, webhooks)
- Alert severity levels (info, warning, critical)
- Alert suppression and deduplication
- Alert history and audit trail
API Endpoints
RESTful API with comprehensive endpoints:
- Metrics API: POST /api/metrics, GET /api/metrics
- Targets API: CRUD operations for monitored targets
- Alerts API: Configure and manage alert rules
- Dashboard API: Retrieve aggregated metrics for visualization
- Health API: System health checks and status
Deployment
The system is fully containerized and can be deployed using Docker Compose:
- Single command deployment:
docker-compose up -d - Automatic service discovery and networking
- Volume persistence for databases
- Environment-based configuration
- Health checks for all services
- Easy scaling with Docker Swarm or Kubernetes
Security Features
- OAuth 2.0 / OIDC: Authentication and authorization via Keycloak 23
- JWT-based authentication: Secure token-based authentication
- Role-based access control (RBAC): Fine-grained permissions management
- API rate limiting: Protection against abuse via Ocelot Gateway
- CORS configuration: Secure cross-origin resource sharing
- Secure password hashing: Industry-standard encryption algorithms
- SQL injection prevention: Parameterized queries with Entity Framework Core
Performance Optimization
- Redis caching for frequently accessed data
- Database indexing for query optimization
- Asynchronous processing with message queues
- Connection pooling for database connections
- Batch processing for metrics ingestion
- Lazy loading and pagination for large datasets
Future Enhancements
- Machine learning for anomaly detection
- Predictive alerting based on historical trends
- Multi-tenancy support
- Advanced data retention policies
- Integration with popular monitoring tools (Prometheus, Grafana)
- Mobile application for on-the-go monitoring
- Custom plugin system for extensibility
Use Cases
- Microservices Monitoring: Track health and performance of distributed services
- Infrastructure Monitoring: Monitor servers, databases, and network devices
- Application Performance: Track application metrics and user experience
- DevOps Automation: Integrate with CI/CD pipelines for deployment monitoring
- SLA Compliance: Ensure service level agreements are met
Learning Outcomes
This project demonstrates proficiency in:
- Microservices architecture design and implementation
- Real-time data processing and streaming
- Message-driven architecture with RabbitMQ
- Clean Architecture and SOLID principles
- Docker containerization and orchestration
- RESTful API design and implementation
- Database design and optimization
- Asynchronous programming in C#
- Testing strategies for distributed systems